Building A Large-Scale Cluster With Kubernetes And Istio
In order to better manage the growing number of services as well as the growth in traffic volume to Houzz, our infrastructure team built a Kubernetes cluster with thousands of processors and terabytes of memory, and migrated our entire web server farm from the Amazon Elastic Compute Cloud (Amazon EC2) to the new Kubernetes cluster. The new cluster leverages cutting edge technologies, including the Istio mesh networking and Spinnaker deployment pipelines.
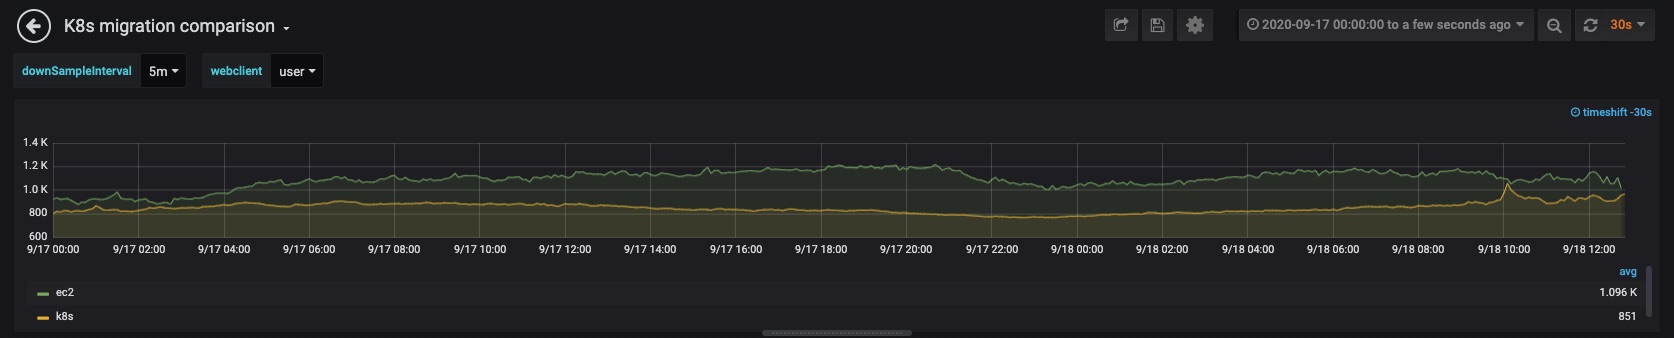
When the migration was completed, we achieved up to 30% improvement in our top page latencies and roughly 33% reduction in compute resources.
With a cluster of this scale, we faced and overcame a number of challenges and encountered various issues that had rarely been reported in the Kubernetes or Istio communities. In the process of creating solutions, we enhanced our logging and monitoring systems, learned about the system internals and tested many variations of the cluster configuration. In this blog post, we will share the design choices we made, explain the solutions we developed and discuss why some techniques did not work. All information refers to Kubernetes 1.16.9 and Istio 1.6.8, unless otherwise stated.
Architecture Overview
All of the Houzz servers that host web, mobile and application program interface (API) requests run in the same Kubernetes cluster. The servers are divided into Platinum, Gold and Silver groups based on Service Level Agreements (SLA). The majority of user requests are served from the Platinum group, where we aim for a 99.9% uptime target. The other two groups serve less critical requests, such as batch jobs. Each SLA group has its dedicated compute resource (EC2 instance group) to ensure performance isolation between the SLA groups. Cluster Autoscaler (CA) is enabled within each SLA group to automatically scale up or down compute resources in response to the fluctuation of resource demand.
There are multiple applications in each SLA group, including a frontend (FE) application written in NodeJS, a backend (BE) service written in HHVM, and a legacy web server. The frontend application communicates with the backend service through the Apache Thrift protocol over HTTP. Each application has its own Virtual Service and Deployment objects. Horizontal Pod Autoscaling (HPA) is enabled on each deployment to automatically scale up or down pods in response to the fluctuation of workload.
The combination of CA and HPA is critical to the 33% reduction in our resource consumption.
The following is a high-level overview of the network architecture:
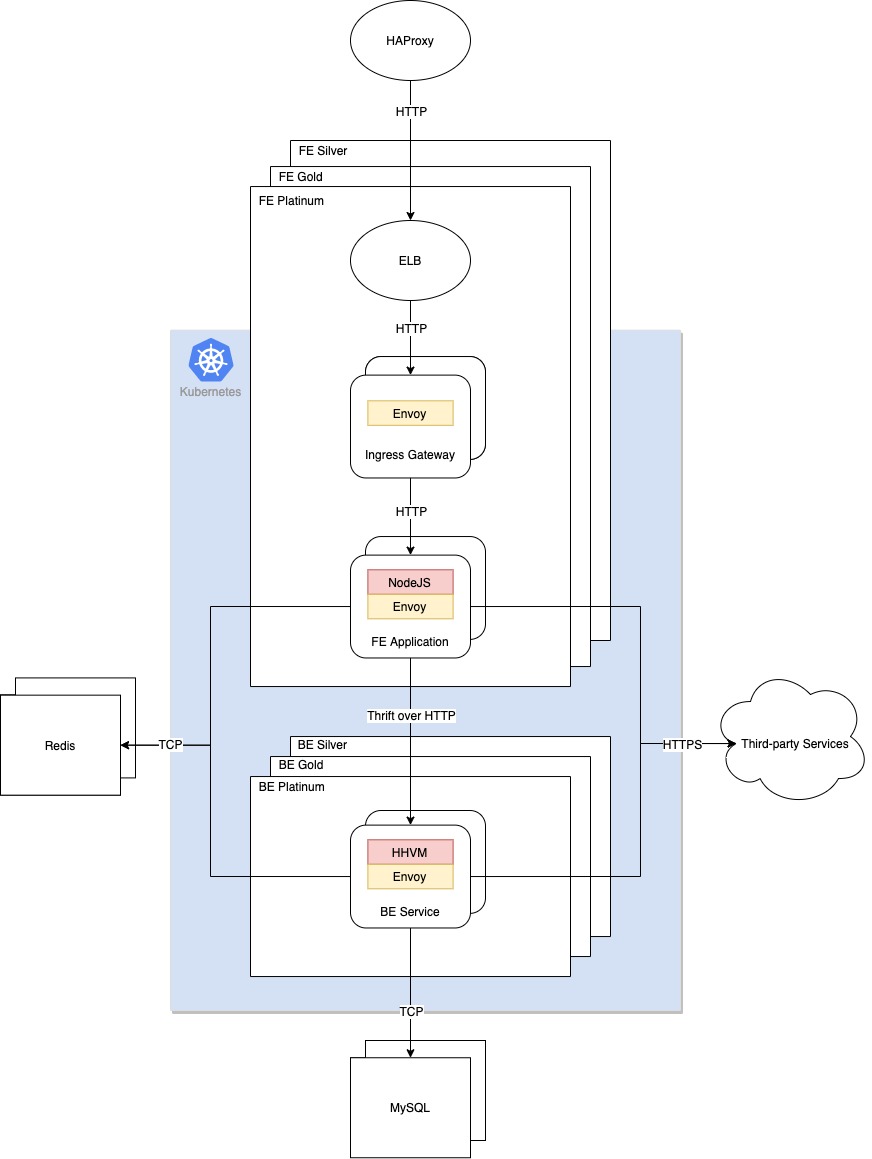
HAProxy serves as the entrance of external traffic to our web server farm. During the migration, we leveraged it to control increased traffic to Kubernetes. An Elastic Load Balancer (ELB) is created for each Kubernetes service and routes traffic to the ingress gateway pods. Ingress gateway is used to manage inbound traffic of the service mesh. It is implemented as a Kubernetes deployment of Envoy proxies running in the router mode at the edge of the mesh. Virtual Service (VS) and Destination Rule (DR) for FE application are bound to ingress gateway for traffic management.
Envoy running in the sidecar mode alongside the applications intercepts all incoming and outgoing traffic. Similarly, Virtual Service and Destination Rule for BE service are visible to the Envoy sidecar in the FE pods for traffic management.
Last but not the least, both the FE application and BE service need access to Redis and other services outside the mesh. Envoy lets those egress traffic pass through.
Istio was critical to the latency improvement up to 30% thanks to its features, such as connection pooling and load balancing. That said, it wasn’t without its challenges, which we will discuss later in this blog post.
Release Process
Our release tools are a combination of open source tools and in-house applications:
– Spinnaker: Spinnaker is the main tool to push Kubernetes configuration changes to all target clusters. It is also used to monitor the release progress.
– In-house service manager: We developed a service manager to manipulate canary percentages, HPA settings and dynamic deployment generation, and integrated it with Spinnaker. It supports parallel execution for a subset of deployments or all deployments.
– In-house release tool:User friendly web UI applications were developed for Release Managers to start and monitor the release processes.
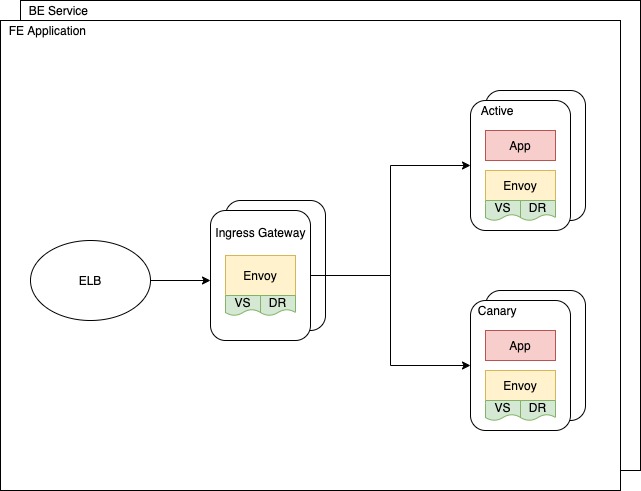
Both our FE and BE pods use a canary rolling update process. By adapting the concept of canary, a new deployment (canary deployment) can be accessed through a canary cookie. At the same time, Istio routes incoming requests to the canary deployment based on the specified traffic percentage, and attaches the canary cookie to every response from the canary deployment. This ensures that future requests in the same session are routed to the canary deployment consistently. In addition to canary, our release process also adopts the rolling update. The number of pods in the canary deployment are gradually increased based on the traffic percentage, while the active deployment is scaled down by HPA.
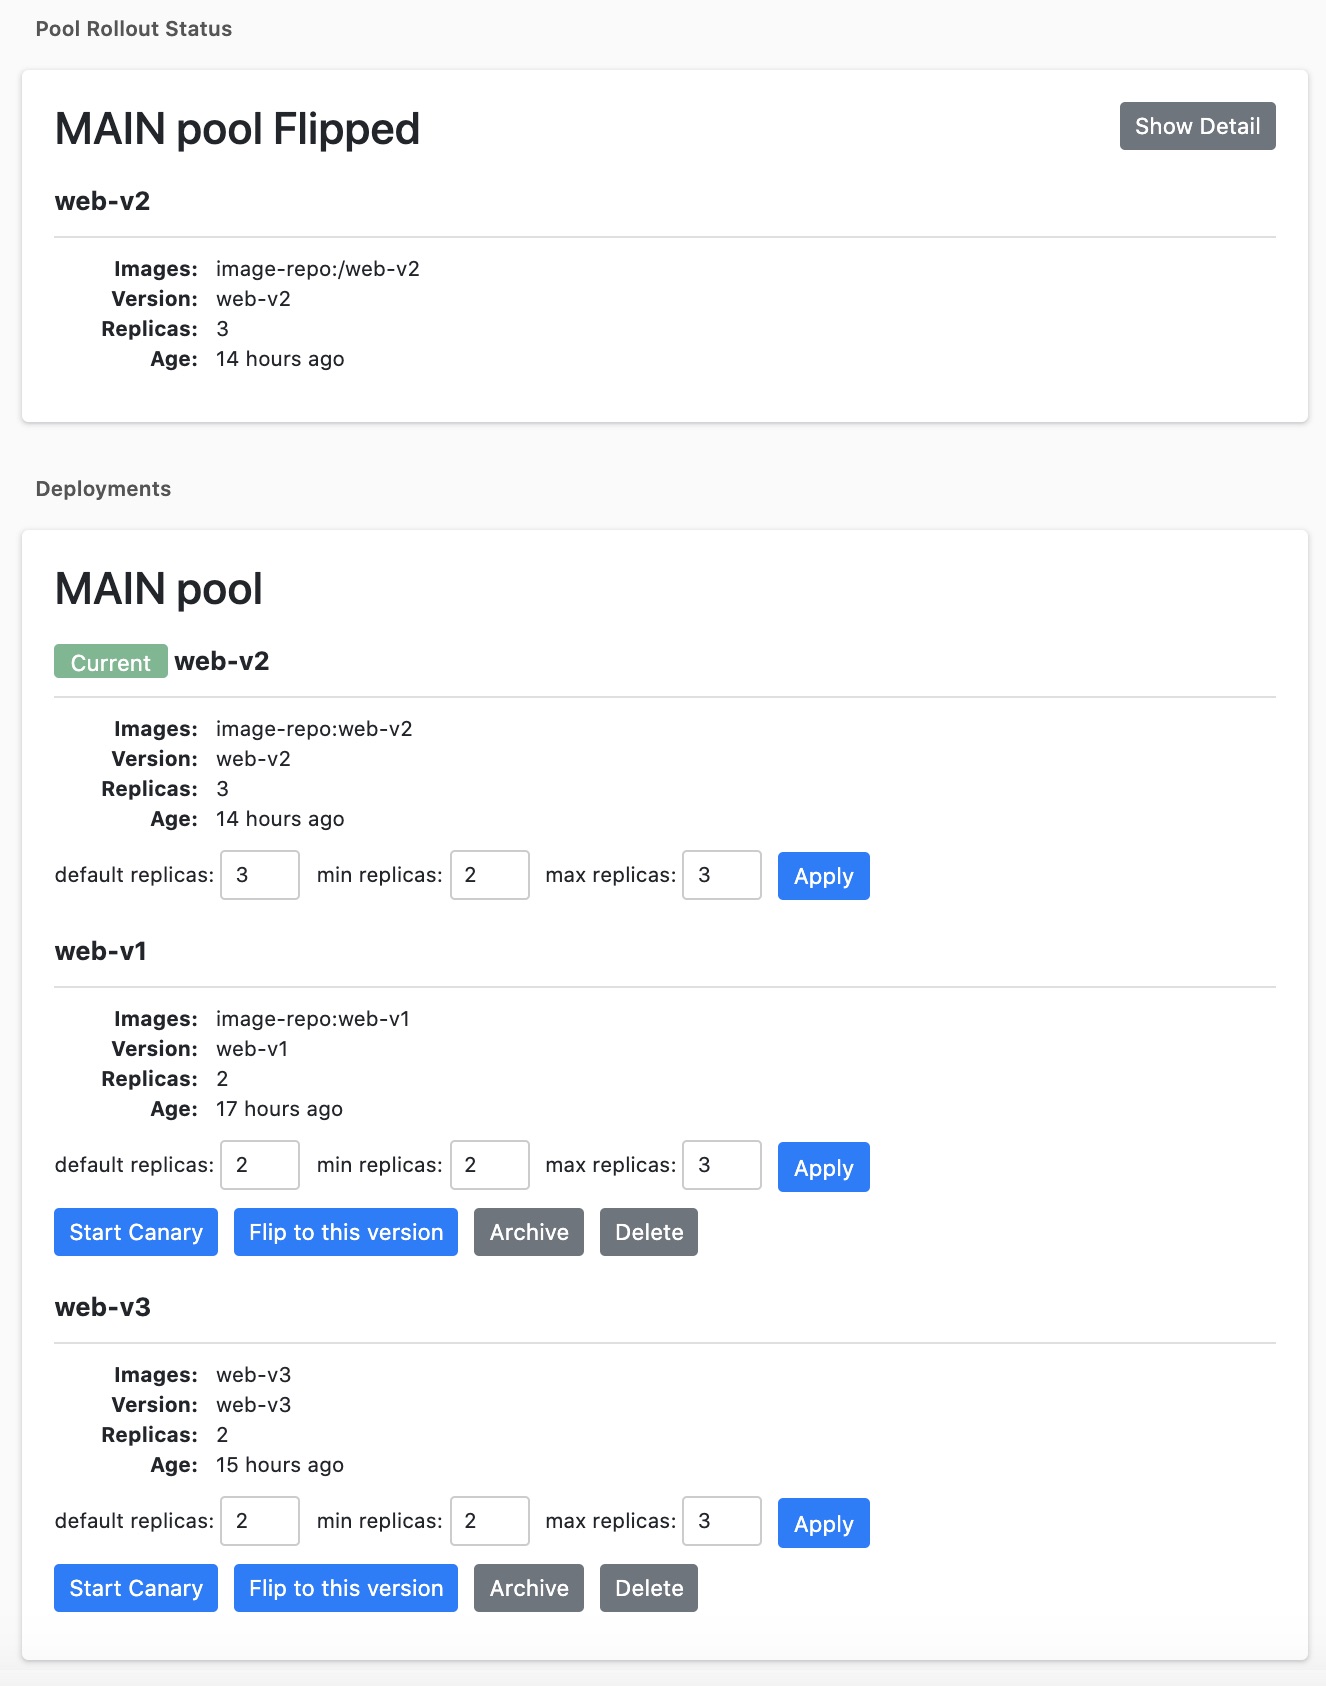
Although Kubernetes and Spinnaker have UI consoles, they are intended for use by Kubernetes administrators. Release Managers (RMs) are typically not Kubernetes administrators. We built a web-based UI tool to enable the RMs to perform release-related tasks without having to learn about Kubernetes operations:
1. Create deployment: Choose a release candidate from the tested production builds and deploy it.
2. Start canary: Once the deployment is complete, start canary with 0% of live traffic. The RM starts automated regression tests and notifies developers to do manual tests for the new features in the release.
3. Ramp up canary: Once the tests passed, the RM ramps up the canary traffic from 0% to 100%.
4. Flip: After the canary is 100% and stable, the RM flips the canary deployment to be active.
5. Clean up old deployment: Either scale down or delete old deployments.
6. Manual scaling: Allow the RM to manually override HPA.
7. Flip back: If we find out the current release has issues, we can choose to use previous stable releases.
This is how the release tool looks:
In the beginning of each release, the service manager detects the number of running pods in the active deployment (referred to as CurrentActiveReplicas below), and gradually deploys the same number of pods in the canary deployment. By doing this, the release tool ensures that an adequate number of canary pods are created to handle the current workload.
The service manager also sets the MaxReplicas in the active deployment to CurrentActiveReplicas, in order to avoid unnecessary pod scaling in the active group due to side effects of the release.
The service manager disables HPA in the canary deployment to prevent unnecessary scaling during the ramp up process. HPA is disabled by setting MinReplicas = MaxReplicas = DesiredReplicas = CurrentActiveReplicas * canary percentage.
After the canary deployment flips to be active and takes 100% of the traffic, HPA is set based on the configured resources for the deployment.
Resource Management
At Houzz, we use saltstack to deploy external packages, configurations and in-house code during the Kubernetes node provisioning process. Normally, the node provisioning process includes hundreds of salt states and can take up to nine minutes. Any failures in salt states can bring the newly provisioned nodes into an “unready” state. So we decided to create a Continuous Integration / Continuous Build (CI/CD) pipeline to ensure the robustness of the salt states.
A new custom Amazon Machine Image (AMI) will be created after all salt states are executed successfully in the pipeline. We will then use the AMI to provision new nodes. Since most configurations and packages have been installed in the AMI, the node provisioning time can be shortened to 3.5 to 4 minutes by skipping most of the salt states.
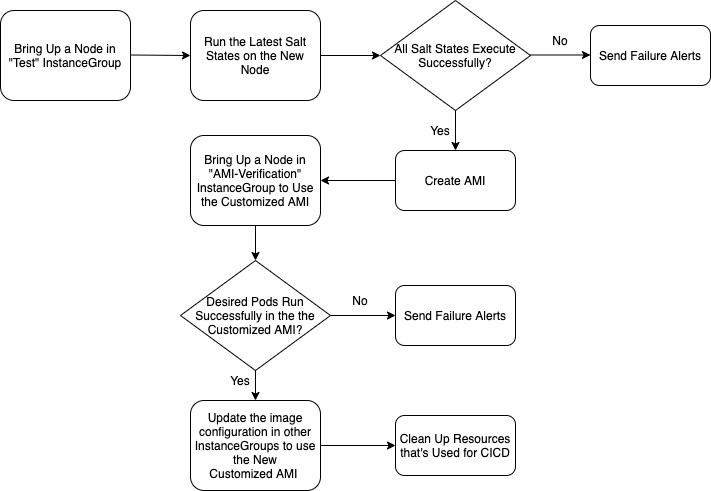
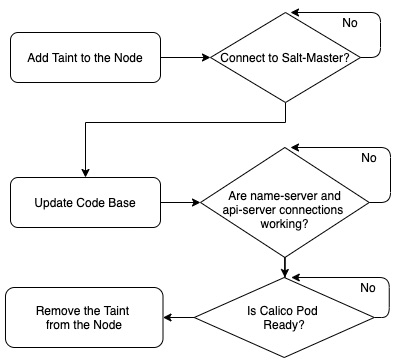
We learned that some critical resources needed to be ready before pods could be successfully started on a node. So we added dependency checks during the bootstrap, and used a taint to prevent pods from being deployed to the newly provisioned node until all the dependency checks have passed.
We allow multiple FE pods to run on the same node since each pod is single threaded and can consume at most one processor. The BE service is multithreaded and can consume as many resources as are available on the node it’s running on. Therefore, we make sure that at most one BE service pod is running on each node through an inter-pod anti-affinity rule. In addition to avoiding hot spots, the anti-affinity rule serves an important purpose in auto scaling and resource management for canary release. As discussed, we will have both active and canary deployments running for each virtual service during the release process. Without the anti-affinity rule, CA would provision only enough resources to satisfy the resource requests by the HPA desired pods. That means we would have to double the number of nodes during the release process in order to host the canary deployment, and terminate the nodes after the release is done. It is not desirable since massive node provisioning may destabilize the cluster and slow down the release process. With the anti-affinity rule, CA would provision a number of nodes ( no less than the number of BE service pods). Given that we set the total pod resource requests to less than half of the cluster capacity, there will be enough resources to satisfy the requests by both active and canary deployments. Therefore, no new nodes need to be provisioned during the release process.
Monitoring
We use Prometheus (a Kubernetes monitoring tool) and Thanos (highly available Prometheus setup with long term storage) to achieve multi-cluster monitoring with the following benefits:
– Highly Available (HA) Prometheus through redundancy, so that if one server fails, the other will continue to function
– Reliable long term storage with Amazon Simple Storage Service (S3)
– Global query view for all metrics
– Downsampling of historical data
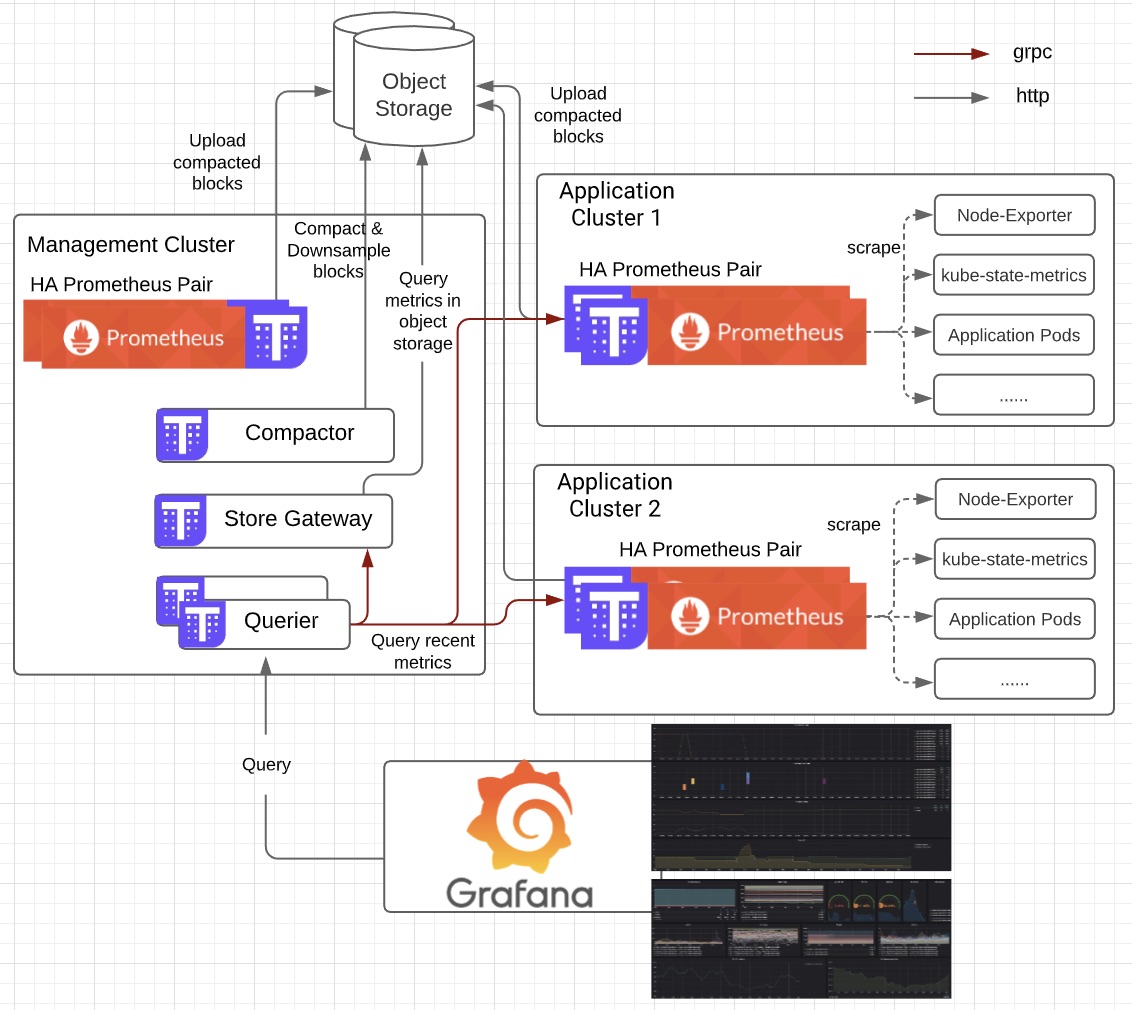
The above figure shows a high-level overview of the monitoring stack with the following major components:
– Prometheus: Combined with several exporters and services that expose metrics, we are able to monitor the whole Kubernetes ecosystem including Kubernetes control plane (etcd, API server, kubelet and ect), worker nodes, Istio service mesh, pods, containers and custom applications.
– Thanos Store: We are able to query historical data stored in the object storage. It keeps a small amount of information about all remote blocks on local disks. This data is generally safe to delete across restarts at the cost of increased startup times.
– Thanos Querier: Our single query endpoint aggregates data from multiple configured backends. In our use case, we let it query Prometheus servers running in several different Kubernetes clusters to get recent metrics, and query Store Gateway to get metrics in object storage. Since we have HA setup, the querier also helps to deduplicate the result.
– Thanos Sidecar: The main component that gets deployed along with the Prometheus server. It uploads metrics to object storage and allows the Thanos Querier to query Prometheus data with the common StoreAPI. Moreover, it watches and manages Prometheus’ rules and configuration and substitutes environment variables in the configuration file.
– Thanos Compactor: The component responsible for the downsampling of data.
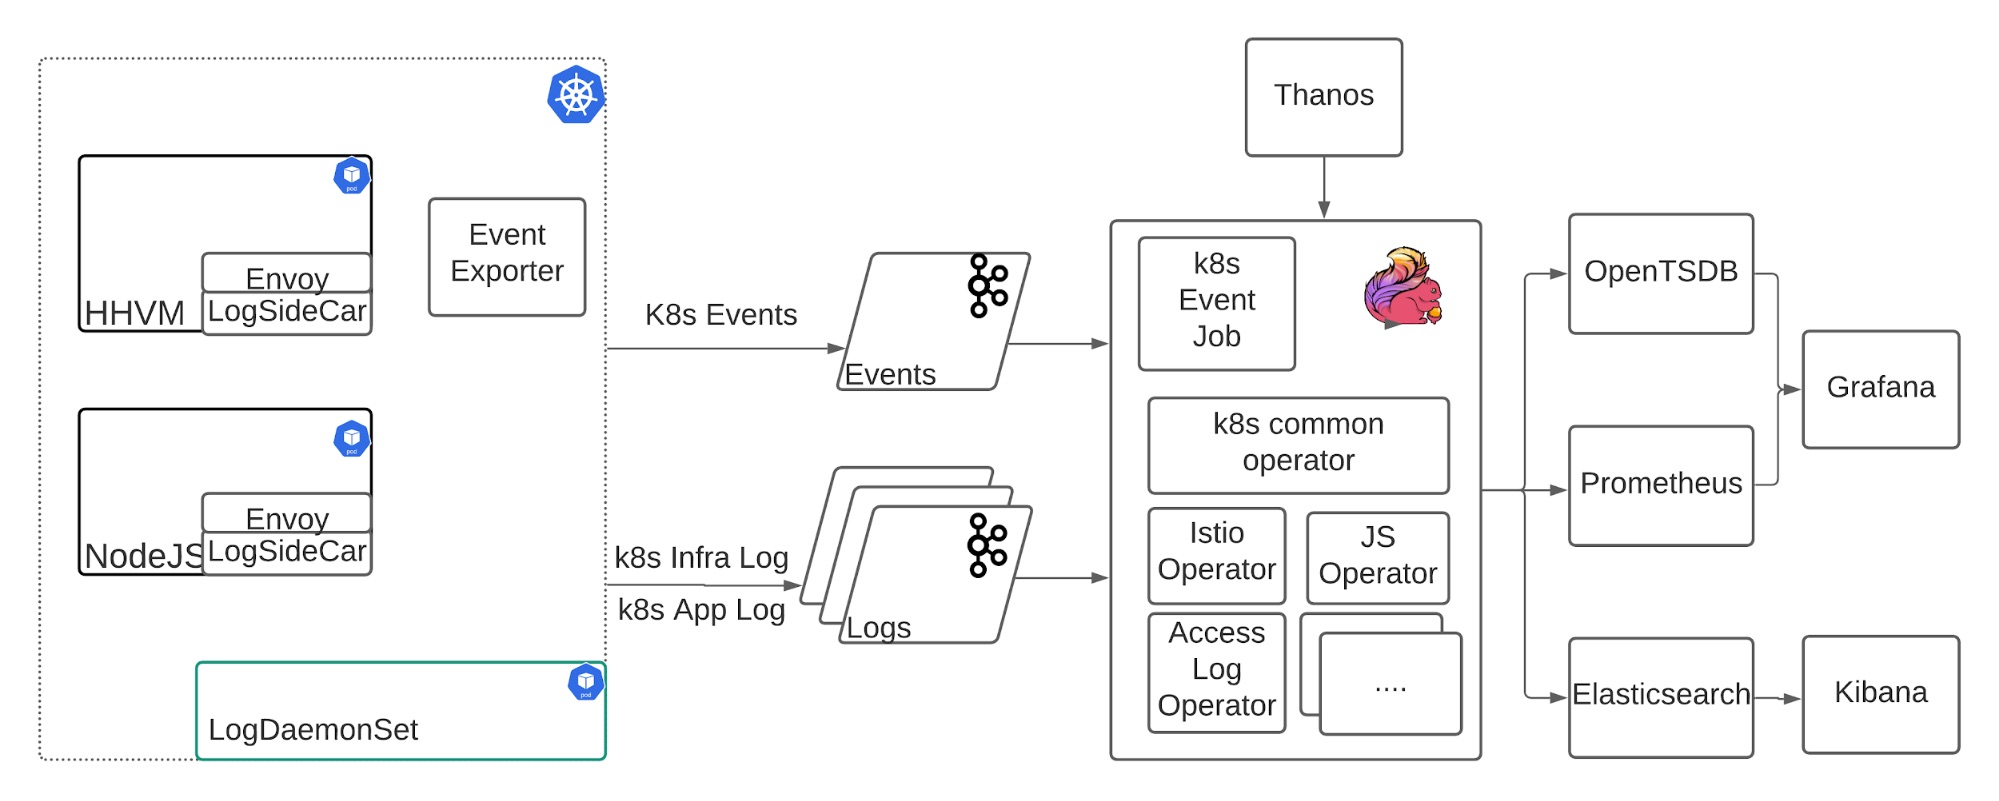
Our Kubernetes logging architecture includes the following components:
– Filebeat: The leaf log collector running as either a sidecar container or daemonset, sending various logs from different sources to Kafka.
– Kafka: The messaging queue to prevent spikes from affecting downstream traffic? and provide a buffer for downstream outages.
– Flink: The log processing framework that enables fully customized log parsing, smart sampling, internal metrics client integration, state management, and dynamic tagging.
– Elasticsearch and Kibana: Provides a full text search and visualization toolset.
One highlighted case covered by Flink is to support Istio cross Availability Zone (AZ) traffic tracing. It parses the inbound and outbound Istio access log and queries the Thanos server to get the source and destination pod name, node name, and availability zone by pod IP address. Then it tags the log with those fields and stores the mapping as a state in Flink for further processing. In Kibana, it can easily do the aggregation by the source/destination AZ/pod/node Information.
To summarize, Kubernetes provides us with the ability to have full control over the services that we want to deploy and allows us to simultaneously scale up, improve latency and save costs. In subsequent blog posts, we will share our experiences in troubleshooting and solving several challenges we encountered during the migration to Kubernetes.
We hope our experience will be useful for other developers to reference as they pursue similar migrations. This is just one of many projects handled by our infrastructure team. If you’re interested in joining us, we’re hiring! Check out opportunities on our team at houzz.com/jobs.